 Login / Register


Loading...

Instruments and Data
Conventional flow cytometers comprise three main components – fluidics, optics, and electronics – which act in synchrony as each sample progresses through the instrument. Crucially, the sample must be in the form of a single-cell suspension to avoid generating misleading results (e.g., due to the presence of doublets) or blocking the flow cytometer.
Read through this section to learn more about the inner workings of a flow cytometer and the general concepts associated with its end readout and data analysis.
Fluidics
The role of the fluidics system is to transport the cells through the flow cytometer. It consists of a central core, into which the sample is injected and surrounded by an outer sheath fluid. The sheath fluid functions to organize the cells into single file, ensuring that they travel at the same rate and are thus analyzed individually. This is achieved by hydrodynamic focusing, whereby the chamber containing the sheath fluid narrows and the fluid velocity increases as the cells progress further into the instrument. Ultimately, the cells are directed past an interrogation point, which is where the instrument’s lasers are focused. The hydrodynamic focusing process is shown in Figure 5.
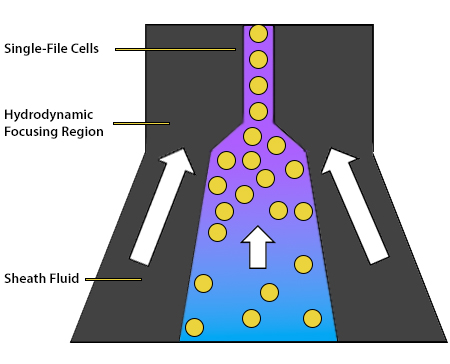
Figure 5. Hydrodynamic focusing creates a stream of cells in single file.
To speed up the event rate (the rate at which individual cells are detected by the flow cytometer) and reduce the sampling time, the pressure difference between the central core and the sheath fluid can be increased. However, this runs the risk of allowing multiple cells to cross the interrogation point simultaneously. In some cytometers, acoustic-assisted hydrodynamic focusing uses sound waves to align cells and is effective even if the pressure has been turned up.
It is worth noting that most flow cytometer fluidics systems are based on either differential pressure or peristalsis. The main difference between these is that a differential pressure system uses a variable regulator to apply pressure to the sample tube and cause sample uptake, while a peristaltic system relies on the use of peristaltic and/or syringe pumps. Because peristaltic systems provide more precise fluid delivery, equating to more accurate cell counts, they are often preferred over differential pressure systems. Where the flow cytometer features the latter, control counting beads are essential for determining the cell concentration.
Optics
When the cells are in single file and ready to pass the interrogation point, optics come into play. These comprise lasers, as well as lenses, mirrors, and filters, which each perform a different function. A general overview of a flow cytometer’s optics can be seen in Figure 6.
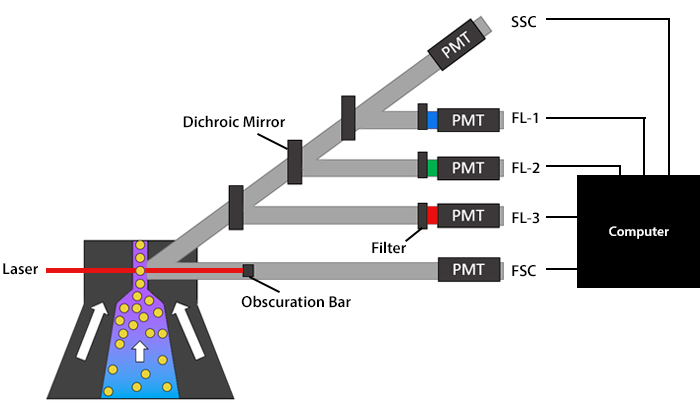
Figure 6. Schematic overview of a flow cytometer’s optics.
- Lasers
Lasers produce light of a single wavelength, known as a laser line, and function to illuminate the sample. They span wavelengths ranging from ultraviolet to far red and vary in terms of power (specified in mW), which can lead to subtle differences being observed between flow cytometers. As a cell crosses the interrogation point, it scatters the laser light. Forward scatter (FSC) data is generated along the path of the laser and is based on the relative size of the cell. Side scatter (SSC) data, which equates to granularity, and fluorescent signals are collected at a 90° angle relative to the laser. Although scatter data can be used for identifying major cell populations in a complex sample such as blood, it is more commonly combined with fluorescence-based detection, whereby lasers serve as excitation sources for fluorophores.
| Laser Line | Wavelength |
|---|---|
| Ultraviolet (UV) | 355 nm |
| Violet | 405 nm |
| Blue | 488 nm |
| Green | 532 nm |
| Yellow | 561 nm |
| Red | 633 nm |
Table 1. Common excitation lasers for flow cytometers.
- Parallel and Colinear Lasers
The lasers within a flow cytometer are typically configured in either a parallel or colinear formation, although some systems are now available that feature both. The main difference between these is that a parallel system spatially separates the laser lines from one another, while a colinear system does not. In practice, this means that a parallel system allows two fluorophores sharing a similar emission profile to be used in the same multiplexed panel due to the optimal excitation laser being different for each. For example, while PE/Cyanine7 is primarily excited by the blue or yellow/green laser and APC/Cyanine7 is excited by the red laser, the emitted photons from each will end up at different detectors as a result of being separated into their respective dedicated paths. While a colinear system precludes this approach, it can be a preferred option for researchers looking for an easier setup and less maintenance compared to parallel laser arrangements.
- Lenses, Mirrors, and Filters
Following laser excitation of the sample, the light is directed to the flow cytometer’s detectors by a series of lenses, mirrors, and filters. The role of the lenses is to collect as much light as possible from each cell, while avoiding extraneous signals, and to collimate (parallelize) that light so that it travels to the detector without converging.
Once the lenses have performed their job, mirrors partition the collimated light by wavelength to ensure each detector only receives light of a specific spectral band. Flow cytometers typically feature dichroic mirrors, which direct certain wavelengths of light toward the relevant detector while reflecting other wavelengths. Dichroic mirrors are either longpass (LP) or shortpass (SP), which respectively let through light above or below a specified threshold. For example, a 600LP dichroic mirror would only allow photons with a wavelength above 600 nm through, while a 400SP mirror would only let photons below 400 nm through.
Filters are positioned in front of the detectors, where they function to control exactly which wavelengths will be measured. Like mirrors, filters may be either longpass or shortpass, although bandpass (BP) filters are the most common and are described in terms of their range. To put this into context, a 780/60 BP filter would be centered on the 780 nm mark and allow through light within a range of 30 nm above and 30 nm below this number - effectively, all wavelengths between 750-810 nm.
Electronics
Detectors form the core of a flow cytometer’s electronics system. Their role is to capture the scattered laser light and any emitted photons and convert them into an electric current. Detectors are usually photodiodes (PDs) or photomultiplier tubes (PMTs), which exhibit certain key differences in how they work. PDs comprise a positive (P) layer with an abundance of holes and a negative (N) layer with an abundance of electrons. When a photon hits the PD, it causes the holes to migrate from the P layer into the N layer, and vice versa, creating a depletion region where no free carriers exist. It is this that gives rise to an electric current.
PMTs instead contain a photocathode, which releases an electron upon being struck by a photon (provided the photon has sufficient energy). This electron is then directed from dynode to dynode for amplification through secondary emission. When the accumulated electrons reach the anode at the end of the dynode chain, they produce an electric current.
Generally, PDs are used for measuring brighter signals (e.g., forward scatter) and PMTs for detecting weaker signals (e.g., low abundance protein targets), due to the amplification that PMTs afford. However, the sensitivity of both PDs and PMTs is highly dependent on the material from which they are manufactured. Other detector types include avalanche photodiodes (APDs), which have greater sensitivity than conventional PDs for far red detection, and charged-coupled device (CCD) cameras, which are most commonly employed for imaging flow cytometry.
After leaving the detector, the electric current travels to an amplifier, where it is converted into a measurable voltage pulse. Finally, the voltage pulse reaches an analog-to-digital converter (ADC), which turns it into a digital number that can be used for analysis purposes.
Data Analysis
Flow cytometry data analysis typically involves selecting a broad cell population of interest before honing in on specific sub-populations, a process known as sequential gating. For example, light scatter might be used for detecting lymphocytes, then CD3 expression for identifying T cells, before other markers are used for characterizing distinct T cell subsets.
Another approach, backgating, can be useful for checking that the population of interest was included in the initial gate. For example, if you believe you have properly identified a population of CD3+ CD25+ FOXP3+ Tregs, you could backgate to confirm that these cells originate from the lymphocyte gate you initially set based on scatter profile and not from a granulocyte population that is exhibiting non-specific antibody binding. Backgating is one of many tools that can be used to ensure reliable results and should always be used in conjunction with appropriate experimental controls.
- Fluorescence Intensity
Although flow cytometry data analysis is centered on fluorescent detection, there are several ways of representing fluorescence intensity. The first of these, the Arithmetic Mean, is a product of the number of events in each channel divided by the number of channels. Another type of mean fluorescence intensity, the Geometric Mean, creates a similar average but accounts for the fact that fluorescent intensity increases in a logarithmic manner, giving it greater relevance. In addition, a measurement known as the Median Fluorescence Intensity uses the midpoint of the population of interest. However, the Relative Fluorescence Intensity, which compares the mean or median fluorescence intensity between different cell populations or studies performed on different days, is generally preferred for its capacity to improve experimental consistency. Whichever measure is chosen, it is important to remember that fluorescence intensity is linked to fluorophore brightness, which can vary according to several experimental factors.
- Single Parameter Data
Single parameter data analysis is the simplest form of flow cytometry data analysis. It involves collecting just one readout (either light scatter or a particular fluorescent signal) from the sample, which is usually displayed on the x-axis of a histogram, with the corresponding number of events (cells) on the y-axis. Figure 7 shows an example of single parameter data.
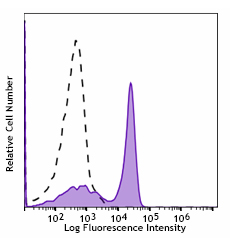
Figure 7. C57BL/6 mouse splenocytes were stained with CD3 (clone 17A2) Spark Blue™ 550 (filled histogram). Open histogram represents unstained cells.
- Multiparameter Data
Multiparameter data analysis is more complex since it involves collecting two or more readouts. In this instance, the data is represented as dot plots, with a different readout on each axis and every dot equating to a single event. Once two parameters have been evaluated, it is possible to gate on a population of interest before creating further dot plots for additional targets. Figure 8 shows an example of multiparameter data.
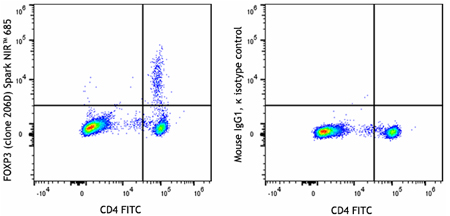
Figure 8. Human peripheral blood lymphocytes were surface stained with CD4 FITC before being treated with the True-Nuclear™ Transcription Factor Buffer Set. Cells were then stained with anti-human FOXP3 (clone 206D) Spark NIR™ 685 (left) or mouse IgG1, κ Spark NIR™ 685 isotype control (right).
- Biological Controls
Controls are essential for setting gates. Recommended flow cytometry controls include biological controls for establishing true positive and negative samples, as well as unstained cells, isotype controls, and secondary antibody only controls for eliminating background fluorescence. Fluorescence minus one (FMO) controls and compensation controls are essential for multiplexed flow cytometry, where they address spectral overlap and remove fluorescence spillover that could lead to misinterpretation of results.
ProductsHere


Follow Us