- Abundance of the population of interest in the tissue.
- Immune cells are very abundant within lymphoid tissues (i.e. bone marrow, thymus, spleen, lymph nodes) but underrepresented in non-lymphoid tissues (i.e. brain, lung, liver, tumor, etc.). When analyzing leukocyte populations in non-lymphoid tissues, the inclusion of markers, such as CD45, in your multicolor panel may be important. CD45, also known as the leukocyte common antigen (LCA), is expressed on all hematopoietic cells except mature erythrocytes and platelets. This marker helps distinguish rare white blood cells from tissue resident cells.
- Some lymphoid tissues contain rare immune cell subsets (i.e. dendritic cells, innate lymphoid cells) and hematopoietic progenitors. To focus on rare populations such as bone marrow progenitors, gate out other populations by including lineage markers in your multicolor panel. Lineage markers are expressed only on terminally differentiated cells and include antigens such as Ter119 (erythrocytes), CD3 (T cells), CD19 (B cells), B220 (B cells), CD11b (myeloid cells), CD11c (Dendritic cells), etc. Cells positive for any of these markers can be grouped together on one "dump channel", minimizing the use of multiple fluorophores (Fig.1a and b). For your convenience, BioLegend offers wide variety of mouse and human Lineage Cocktails.
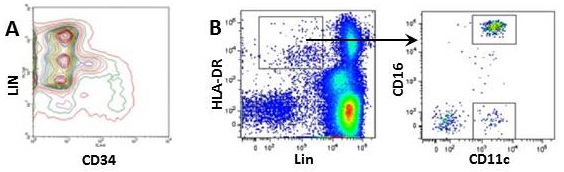
Figure 1. Using lineage markers to help define a rare population.
A) Staining of hematopoietic progenitors using BioLegend mouse lineage cocktail (CD3, GR1, CD11b, B220, Ter119) and anti-mouse CD34 antibody in mouse bone marrow; B) Gating of human DC cells using BioLegend human lineage cocktail (CD3, CD14, CD19, CD20, CD56) and anti-human HLA-DR antibody.
Try using bivariate graphs (dot plot or pseudocolor plot) instead of histogram when gating populations expressing markers found on other cell types. For example, Figure 2 shows the difference between gating strategy of mouse dendritic cells using one dendritic marker CD11c on histogram or two dendritic cells markers, CD11c and MHC Class II, on a pseudocolor plot. Based on the bivariate plot, the percentage of true DCs (CD11intMHCII+) is 1.2% and not 4.5% DCs like shown on the histogram. The difference in percentage between the pseudocolor plot and histogram is a result of inaccurate gating of outliers (CD11cintMHCII+/-) in the histogram. To know more about different options of plotting the data, read our blog Flow Cytometry Data Analysis I: What Different Plots Can Tell You.
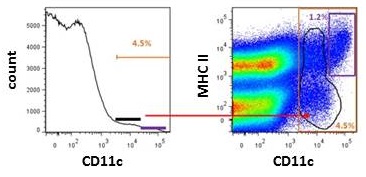
Figure 2. Gating of dendritic cells using histogram and bivariate plots
- Subcellular localization of target. When working with intracellular targets such as cytokines, transcriptional factors and phospho-proteins; fixation and permeabilization of cells with specialized buffers is required. Our Guide to Flow Cytometry Buffers will help to make a right choice based on subcellular localization of the protein of your interest.
- Autofluorescence. Cells have a natural level of fluorescence which is a result of light emission from biological structures (i.e. mitochondria, lysosomes) and compounds (i.e. NADPH). Most autofluorescence is detected in channels that capture shorter wavelengths like BV421™, FITC and PE (Fig.3). The level of autofluorescence varies depending on the size, activity, and granularity of cells. In general, larger and more granular cells, such as myeloid cells, have increased autofluorescence due to high levels of intracellular fluorescent compounds.
- Expression of scavenger receptors.
- Myeloid cells (monocytes, macrophages, dendritic cells and granulocytes) express Fcγ receptors which can bind to the Fc region of antibodies resulting in non-specific staining. To minimize this nonspecific staining, include FcR blocker in your staining when working with samples enriched in myeloid cells (i.e. bone marrow, blood, spleen or in vitro differentiation cultures of myeloid cells).
- Some tandem dyes including PE/Dazzle™ 594, APC/Fire™ 750, PE/Cyanine7, PE/Cyanine5, PerCP/Cyanine5.5 and especially APC/Cyanine7, can non-specifically bind to monocytes and macrophages independently of Fc receptors. Use of True-Stain Monocyte Blocker™ in flow cytometry staining can help to minimize the nonspecific binding. Learn more with our scientific poster.
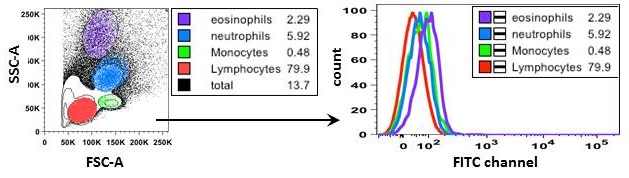
Figure 3. Autofluorescence of leukocyte populations observed in FITC channel. On the left, gating strategy of unstained mouse peripheral blood leukocyte subsets based on forward and side scatter. On the right, histogram overlay of autofluorescence between lymphocytes (red), monocytes (green), neutrophils (blue), and eosinophils (purple).
- Temperature. Exposure to low or high temperatures can lead to rapid internalization of surface proteins such as chemokine and cytokine receptors (i.e CCR7, CD115/M-CSFR). To get more tips on surface receptor staining including chemokine receptor staining, check out our blog post.
- Stimulation. Antibody or cytokine-mediated stimulation of cells often leads to internalization of their respective surface receptors. For example, anti-CD3 antibody stimulation of T cells leads to downregulation of the TCR/CD3 complex on the surface of T lymphocytes. To help mitigate this issue, when staining T cells in culture, we recommend enriching the population of interest before stimulation, using an alternative gating strategy, or staining intracellularly to detect total CD3.
- Enzymatic digestion of tissue and cells can affect the antibody binding epitope. For example, Trypsin/EDTA treatment of adherent cells can result in cleavage and inactivation of cadherins, making it difficult for the anti-cadherin antibodies to recognize its target. Optimize your tissue/cell preparation protocol (i.e., use a gentler detachment solution like Accutase®) and pilot staining using different antibody clones to define optimal conditions and appropriate reagents for your study.
- Fixation can also affect the antibody binding epitope. Check our Fixation page to see which antibody clones are compatible with surface staining after cell fixation. If information on the clone of interest is not provided, we recommend performing surface staining before fixation of cells.
|
 Login/Register


Follow Us