 Login / Register


We understand that the Cell Markers page has many markers for you to examine. For a more simplified approach on phenotypic markers, you can check out the charts below, which lists markers commonly used in literature to identify populations of the given cell types. There may be other combinations of markers used for these cell types not listed here. Further subset clarification would also require a more expanded set of markers for each cell type. For more in-depth information on your cell of interest, search for reviews or head back to our Cell Markers page.
Once you know what markers you want, you can start building your multicolor flow panel here.
Loading...
Essential Markers
| Human | |
|---|---|
| B Cells | CD19 |
| T Cells | CD3, CD56(-) |
| Activated T Cells | CD25, CD69 |
| Dendritic Cells* | CD1c, CD83, CD141, CD209, MHC II |
| Plasmacytoid Dendritic Cells* | CD123, CD303, CD304 |
| Platelets (resting) | CD42b |
| Platelets (activated) | CD62P |
| Natural Killer Cells | CD3(-), CD16, CD56 |
| Hematopoietic Stem Cell | CD34, CD90 |
| Macrophage* | CD11b, CD68, CD163 |
| Monocyte* | CD14, CD16‡, CD64 |
| Plasma Cells | CD138 |
| Red Blood Cells | CD235a |
| Neutrophils | CD15, CD16, CD49d(-) |
| Basophils | 2D7 antigen, CD117(-), CD123, CD203c, FcεRIα |
| Eosinophils | CD11b, CD193, EMR1, Siglec-8 |
| Mouse | |
|---|---|
| B Cells | CD19 |
| T Cells | CD3, CD49b (clone DX5) (-) |
| Activated T Cells | CD25, CD69 |
| Dendritic Cells* | CD11c, MHC II |
| Plasmacytoid Dendritic Cells* | CD11cint, CD317 |
| Platelets (resting) | CD41 |
| Platelets (activated) | CD62P |
| Natural Killer Cells | CD3(-), CD49b (clone DX5) |
| Hematopoietic Stem Cell | CD48, CD117, CD150, Sca-1 |
| Macrophage* | F4/80, CD68 |
| Monocyte* | CD11bhi, CD115hi, Gr-1lo, Ly-6C‡ |
| Plasma Cells | CD138 |
| Red Blood Cells | TER-119 |
| Neutrophils | CD11b, CD115(-), Ly-6B.2, Ly-6Clo/neg, Ly6G, Gr-1 |
| Basophils | CD200R3, FcεRIα |
| Eosinophils | CD11b, CD193, F4/80, Siglec-F |
*Antigen presenting cell subsets (and other cells here) can express different markers and be challenging to analyze. To learn more about your specific cell type, check out our Explore and Learn section.
‡This marker’s expression is variable, but is used to further analyze subclasses of this cell type.
Examining CD45 expression and forward and side scatter profiles can help you identify your population of interest. The image below was edited from Im, M. et al.
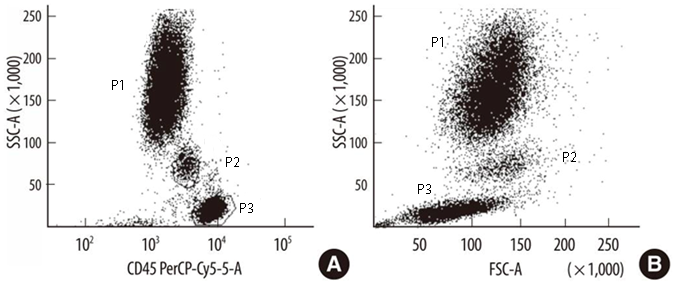

Human peripheral blood leukocytes (A) after staining with anti-CD45 showing discrete granulocyte (P1), monocyte (P2), and lymphocyte (P3) populations according to the level of CD45 expression. (B) FSC and SSC on the scattergrams.
References:
- Sunderkötter, C. et al. 2004. J. Immunol. 172:4410. Pubmed (Mouse Monocytes)
- Murray, P.J. and Wynn, T.A. 2011. Nat. Rev. Immunol. 11:723. Pubmed (Human Macrophages)
- Zhang, X. et al. 2008. Curr. Protoc. Immunol. Chapter 14:Unit 14.1 Pubmed (Mouse Macrophages)
- Moore, A.J. and Anderson, M.K. 2013. Adv. Hematol. 2013:949513. Pubmed (Human and Mouse Dendritic Cells)
- Lee, J.J. et al. 2012. J. Allergy Clin. Immunol. 130:572. Pubmed (Human and Mouse Eosinophils)
- Macey, M.G. Flow Cytometry: Principles and Applications. Totowa: Humana Press Inc. 2007. Digital. Link (Human Neutrophils)
- Kim, H.J. et al. 2010. PLoS One. 5:e11439. Pubmed (Mouse Neutrophils)
- Maecker, H.T. et al. 2012. Nat. Rev. Immunol. 12:191. Pubmed (General Human Markers)
- Lai, L. et al. 1998. J. Immunol. 160:3861. Pubmed (General Mouse Markers)
ProductsHere


Follow Us