 Login/Register


Expected Cell Frequencies
| While designing an experiment there are a number of important factors to take into account. One of these factors may be the expected frequency of cells in a given sample. This information can help dictate your fluorophore choices when building a multicolor panel, help you determine a sufficient number of events to collect in your experiment, and potentially predict how long you'll need to run the instrument. It could even help you better determine the expected yield of a magnetic cell separation experiment. |
| Of course, the exact frequency of any cell type that you see in your experiment will vary depending on a number of factors including the antibody clone/fluorophore chosen, gating strategy, sample processing or treatment, and donor/strain variability (just to name a few). The charts below describe cell compositions of common sample types in both human and mouse and can be used as a helpful reference to better plan your experiments. Given the caveats mentioned above, they shouldn't cause alarm if your results don't align perfectly as this should only be used as a guide or first step in planning your experiments. |
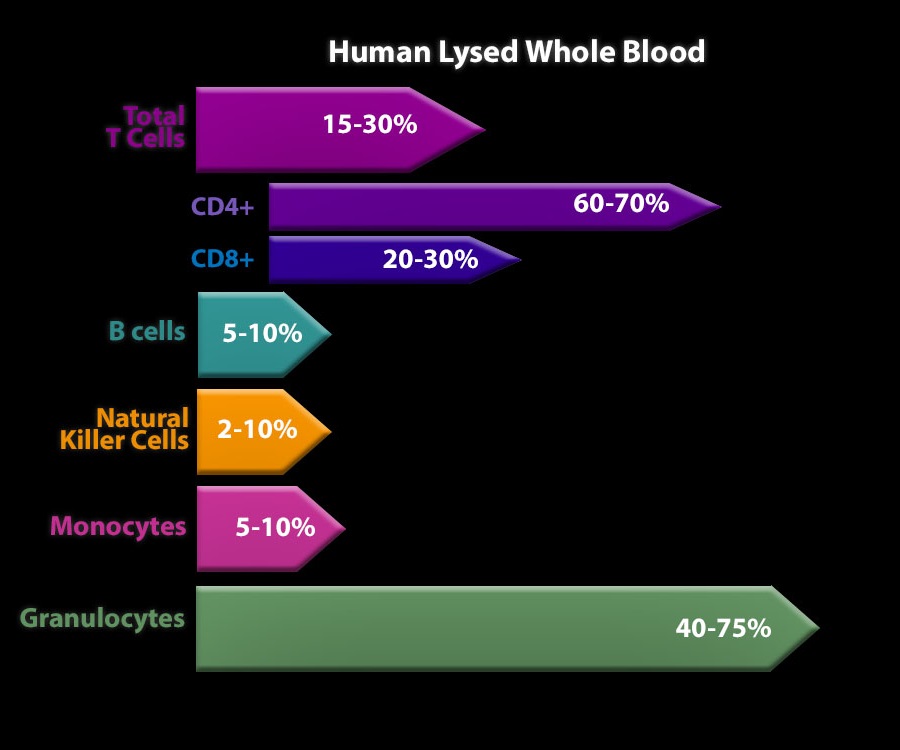
| Human | |
| Two common sample types when studying human immune cell subsets are peripheral blood mononuclear cells (PBMCs) and lysed whole blood. Typically, PBMCs are isolated using density gradient separation methods (such as our Lymphopure™ reagent) in which other cell types, such as erythrocytes and granulocytes, are removed from the sample. In the charts below, the frequency of CD4+ and CD8+ T cells is represented as a percentage of total T cells. We also offer Veri-Cells™ products, which are lyophilized control cells that you can use as a reference point for your samples. |  |
| In addition to in-house data, the following publications were used to compile the data. PBMCs:
Lysed Whole Blood:
|
 |
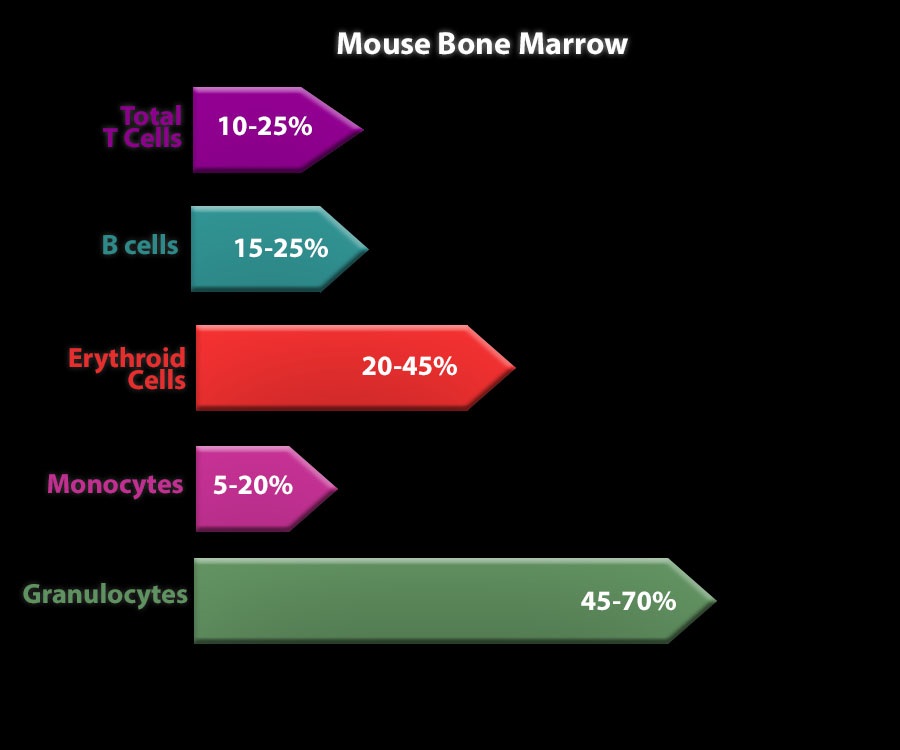
| Mouse | |
| When studying mice, there are a number of tissues or cell compartments that you can analyze. Below, we've presented common cell frequencies in two of these populations - spleen and bone marrow. Given the vast number of mouse models and strains available, these frequencies may vary and these compositions were based on data collected from C57BL/6 mice. Note that the frequencies represented in the spleen chart represent a cell composition of a spleen sample following red cell lysis and the CD4+ and CD8+ percentages are listed as a percentage of total T cells. |  |
| In addition to in-house data, the following publications were used to compile the data. Spleen:
Bone Marrow:
|
 |
| These guides may help give you a better idea of the expected cell composition in your sample to better help you plan your experiments, especially if you are working in a new species or sample type. While building your flow panel, you may also want to check out our recent blogs focusing on other sample considerations and using the ideal compensation controls. As always, if you have any questions while planning your experiments, feel free to reach out to our technical services team at tech@biolegend.com. |
| Contributed by Kelsey Swartz, PhD. |


Follow Us