 Login / Register


Flow Cytometry Data Analysis II: Show Your Hidden Data
| Now you think that you know the pattern of expression of the molecule you are investigating. You think you know the sample you are investigating. You think you know how it should look when you stain your cell…Well, stop thinking so much and look at the data. Seriously. | |
| Many factors can affect the way your cells will appear in the cytometer, some of which you simply can't control. One such factor is the autofluorescence of your cells. If you do not properly display your cells, you can end up gating inaccurately. And you may be as surprised as I was when I bought this apple! Looking at only one parameter without going deep into the plots can mask the nature of your cells. | |
| Autofluorescence in biological samples is intrinsic to some cellular components, and it varies from cell to cell. It is dominated by reduced pyridine nucleotides (NAD(P)H) and oxidized flavins (FAD), although other components of the cell may account for their emitted fluorescence upon laser excitation (there are even more in plants!). There may be ways to reduce the impact of autofluorescence (wait for a post on this!), but you can certainly gate around it when you have it. Autofluorescence is most evident in the FITC (FL1) and PE (FL2) channels. In this example you can see how showing a histogram does not fully reflect the origin of the fluorescence and the distribution of the populations. |
|
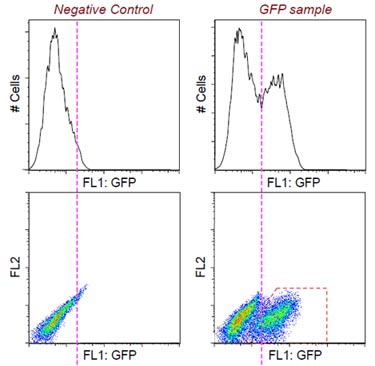 Cells expressing GFP which fluoresce in FL-1 |
|
| By making a diagonal gate around the GFP positive population in the dot plot (rather than the histogram) it is possible to more accurately define the population. If we analyze the same plot, we can see the origin of the fluorescence for different cells: | |
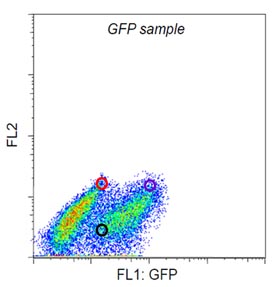 |
The origin of the fluorescence for the cells in the different circles are: Red, autofluorescent (showing in both FL1 and FL2) Black, FL1 emission comes from both GFP specific and autofluorescence, with little or no emission in FL2 Purple, GFP specific emission only in FL1 and high autofluorescence in FL2 |
| In this situation is always useful to have an unstained control, or an FMO (Fluorescence Minus One) control. This will help to set up your gates. So next time someone tells you something like, YES I SWEAR, THAT POPULATION JUST EXPLODES WHEN I TREAT MY MICE WITH SUGAR-SWEETENED PBS...ask for the data first. |
|
| For further reading, we can recommend you this paper: J Immunol Methods. 2012 Dec 14;386(1-2):101-7. It is regarding the controversial description of FoxP3-expressing macrophages; the expression could be autofluorescence. If you have any questions or comments, please just email us, mtam@biolegend.com | |


Follow Us