 Login/Register


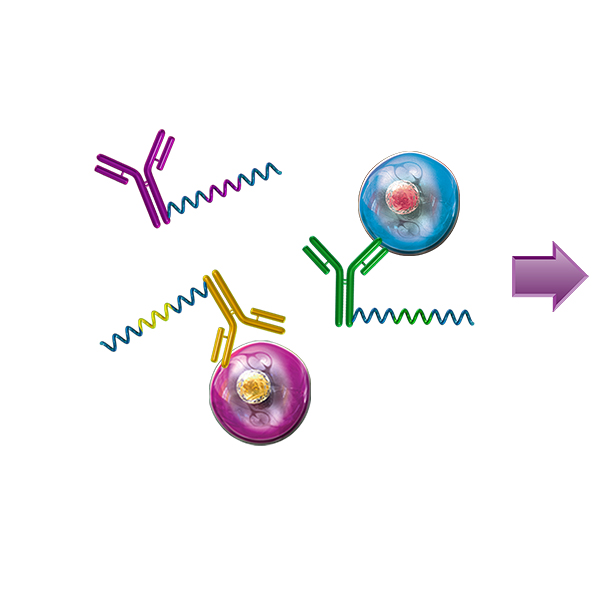
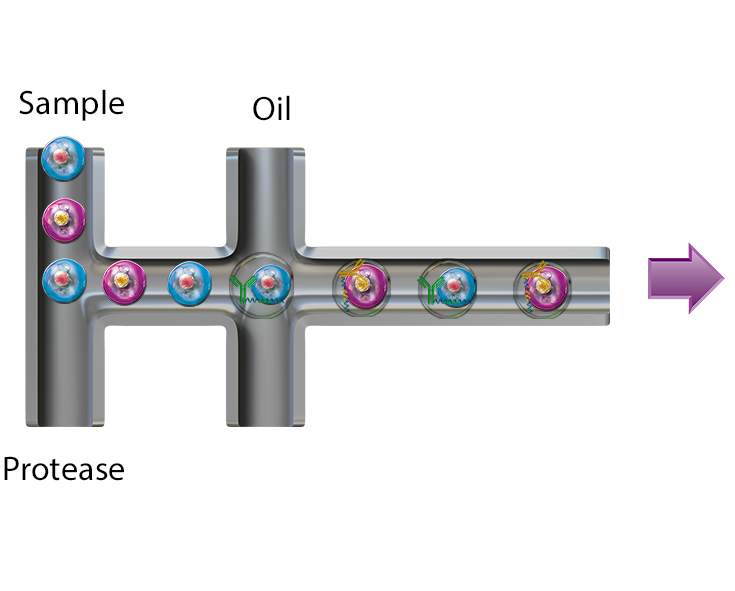
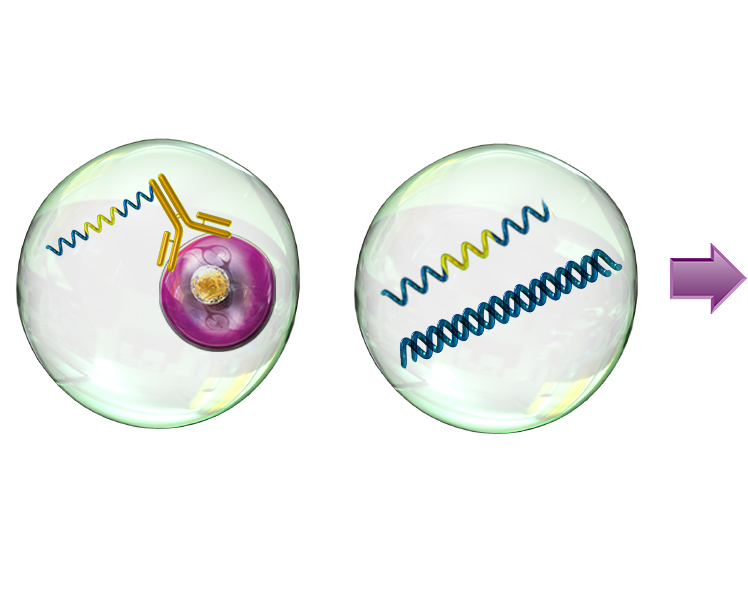
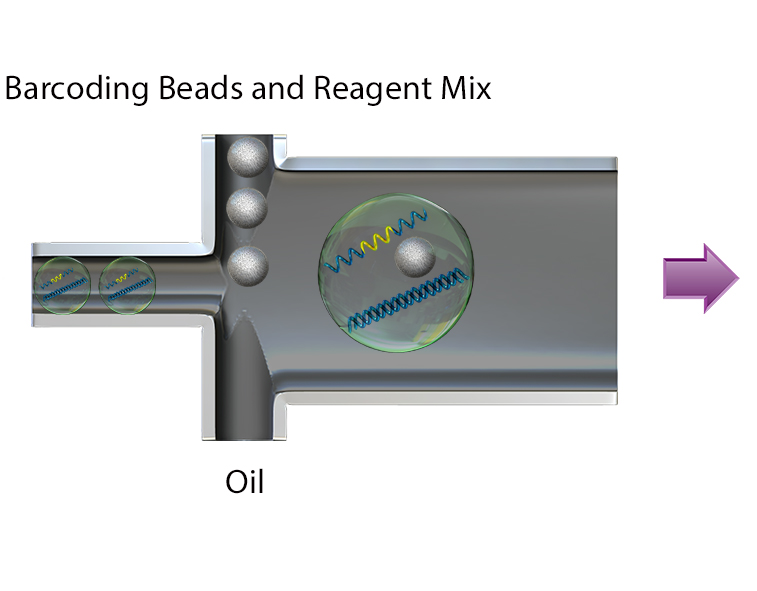
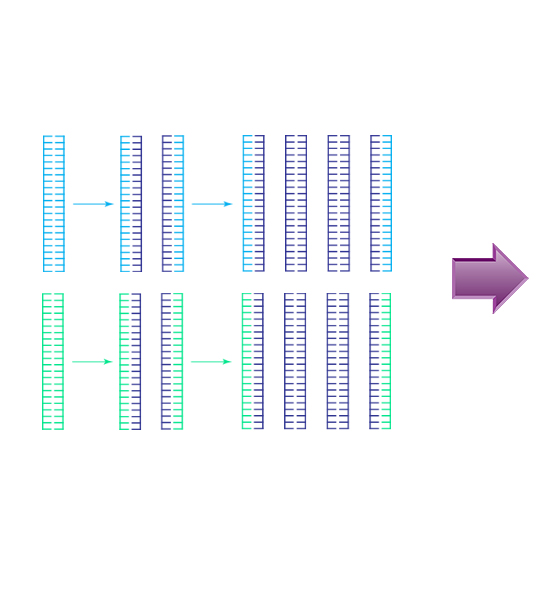
Resolve complex genetic questions from genotype to phenotype by combining single-cell genetic analysis with protein detection using TotalSeq™-D oligo-conjugated reagents. Single-cell sequencing overcomes many of the limitations presented by bulk-sequencing by increasing the sensitivity and enabling the resolution of different genotypes within a heterogenous sample, which is critical for understanding complex diseases like cancer. Resolution is increased by the addition of protein expression measurements and allows you to:
- Perform simultaneous immunophenotyping to determine whether mutations are associated with specific cell types or states
- Discover new targets
- Link genotype to phenotype by co-detecting SNVs/indels, CNVs, and proteins simultaneously
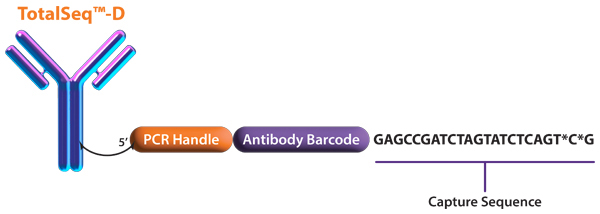
Uncover genetic variations in heterogenous samples using Mission Bio’s Tapestri platform and add BioLegend’s TotalSeq-D antibodies to correlate these mutations with protein expression.

 products. For example, for any technology platform Buyer uses with TotalSeq


Follow Us