 Login / Register


The Stain Index: What Is It and What Does It Tell You?
| Thanks to advancements in fluorophore chemistry in recent years, there are many choices available for flow cytometry. This widens our research tools and expands our capabilities to characterize complex populations. But at the same time, it forces us to decide…what do I choose? Which one is better, PE or Brilliant Violet 421™ (BV421™)? The answer is not so straightforward, so we'll try to discuss it here. |
|
Scientists have agreed that the overall brightness of a fluorophore can be estimated by the relationship between the positive and the negative (background) signals. In turn, the background in a particular detector is affected by:
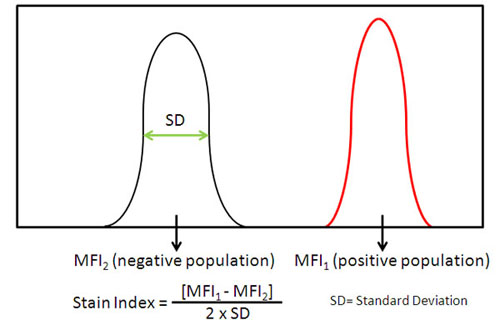
As the brightness is relative to those factors, how do we normalize them? Assuming that other variables remain constant, (we'll discuss this at the end), a reasonable measurement is the ratio of the seperation between the positive and the negative population divided by two times the standard deviation of the negative population. This ratio is called "Stain Index (SI)". |
|
| In other words (and graphics): | |
 |
|
| If another fluorophore produces a lower Mean Fluorescence Instensity (MFI) for the positive population than the previous example with the same MFI background, its stain index is going to obviously decrease, as the seperation between the positive and the negative population is reduced: | |
 |
|
| Also if another fluorophore can produce an MFI for the positive population similar to the first example, but has a larger variation in the negative population (even with the same MFI), its stain index is going to be also lower. This makes sense, as it is not as good at resolving the two populations as the first one: | |
 |
|
| To have a comparison, different fluorophores conjugated to the same clone are tested side by side and their stain indices (SI) are calculated. After the index is calculated, one could categorize or rank the fluorophores, to make it is easier to compare them. For example, PE, BV421™ and APC are ranked at the top (in a scale of 1 to 5 with 5 being the maximum) even when their SI may be different. | 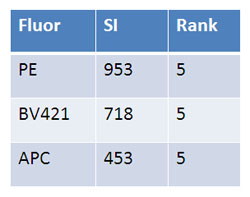 |
| Data was obtained at BioLegend using a BD LSR II Fortessa™. The same anti-human CD8 clone was used on human blood cells. | |
So, the brightness of the different fluorophores can only be relative due to the multiple variables affecting their performance. These specific factors, among others, can significantly affect the stain index of any fluorophore:
Since conjugation processes and f:p ratios can vary from company to company, it is important to understand that SI values can also vary accordingly. For quick reference, BioLegend uses a ranking system to describe the relative brightness compared to other fluorophores in the catalog, based on the SI of each. This ranking goes from 1 to 5, with 1 being the dimmest and 5 being the brightest. Take a look at our brightness index table and our Multicolor Staining Guide for more information. Do you have any ideas or comments? Just email us: mtam@biolegend.com. |
|


Follow Us